Palm oil prices fall throughout December, but could rise again
1 RM (Malaysian Ringgit) = 0.22 USD
1 USD = 0.80 GBP
*Exchange rates calculated and market prices reported on January 6, 2025
Crude Palm Oil
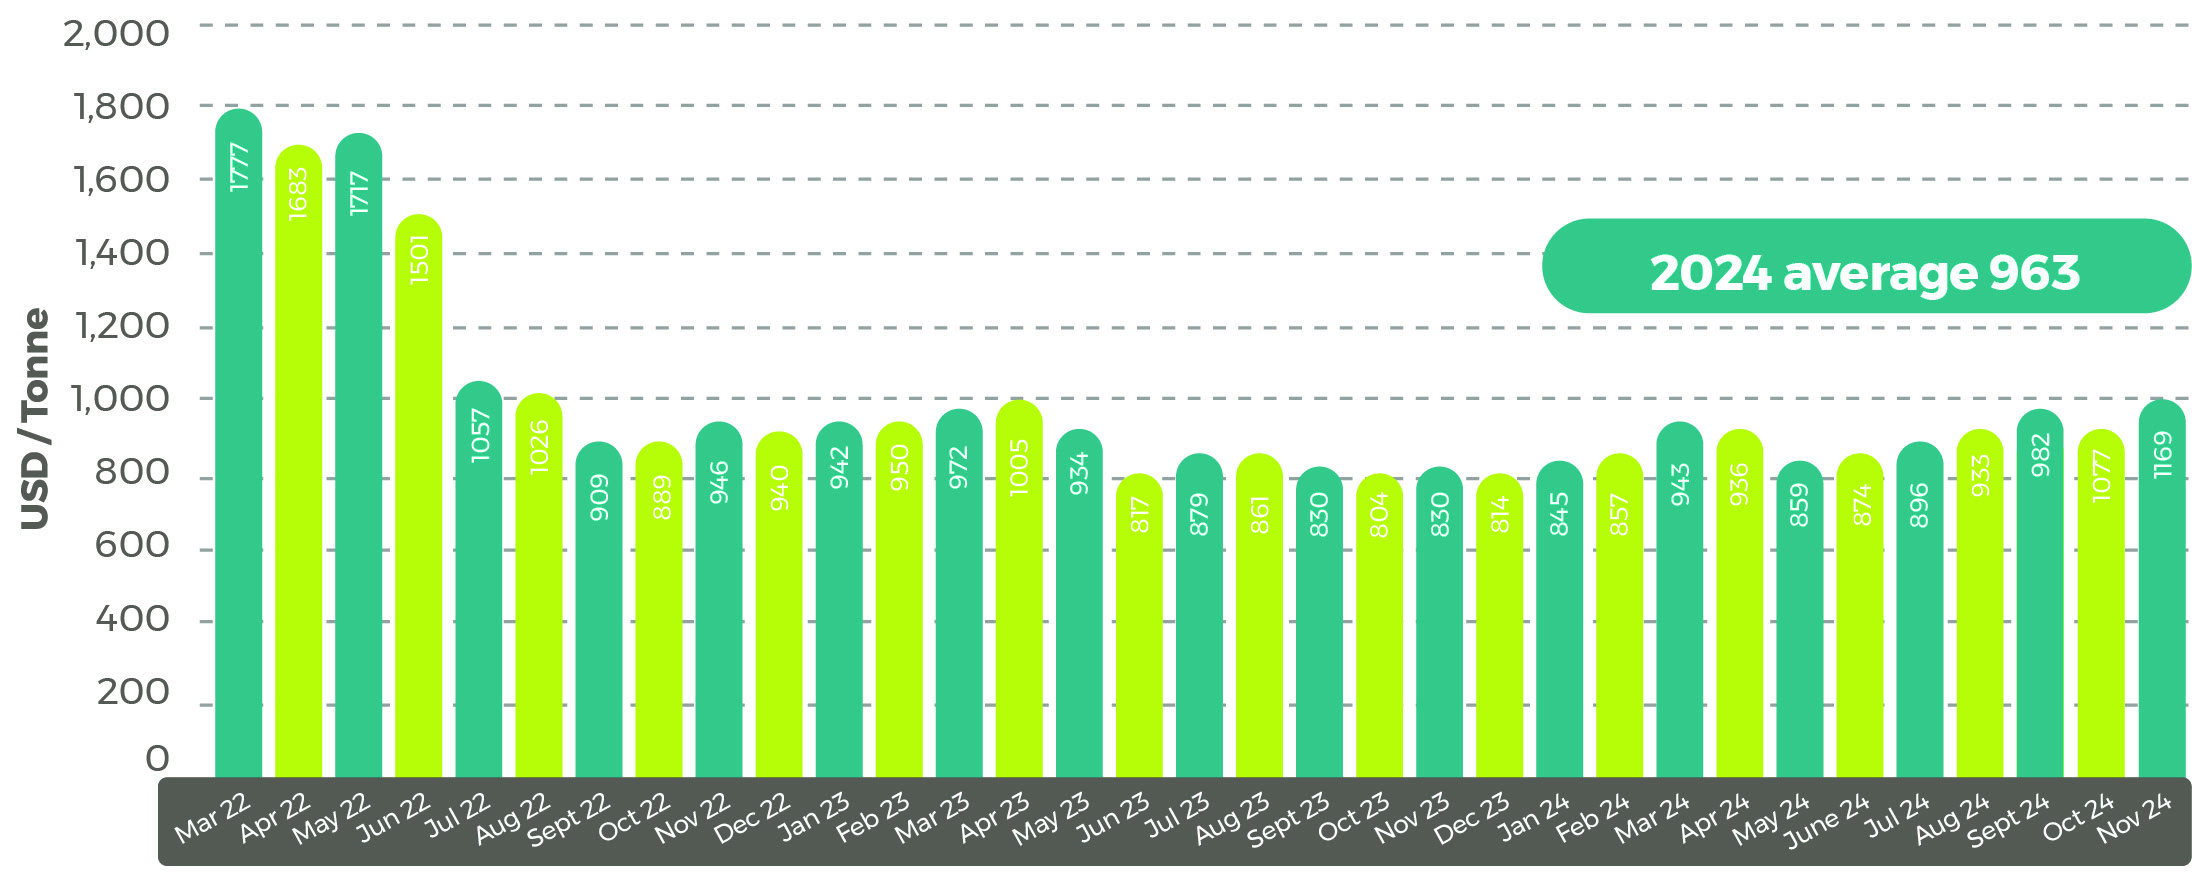
Average World Bank 2024 palm oil price
US$963/tonne (+US$77)

Malaysia palm market
Palm oil prices were generally weaker in December, with the Malaysia CPO Settlement price ending the month at RM4,452/tonne (US$979), a drop of 11.3% on the end of November price. However, that was 19.6% more than the year before, but 37.3% lower than the all-time highest price set in April 2022 soon after Russia’s invasion of Ukraine.
Prices had reached a two-and-a-half-year high in November, before slipping and then rallying in the middle of December, reaching a monthly peak of RM5,117/tonne (US$1,126) on the 6th. Values then fell and were down to RM4,432/tonne (US$975) on the 20th of December. Prices held at those levels for the rest of the month, including over the festive period. Values slipped again in early January 2025 trading.
Competition from other oils after the increase in Malaysian palm oil prices in November and lower Malaysian palm oil exports put pressure on prices during December. Although prices fell in the first few days of January trading, there is speculation that strong Indian demand for palm oil could push prices up again.
Malaysia CPO Settlement Price RM

Vegetable oil
More soybeans lift global oilseed production
In its most recent global vegetable oil report, the USDA’s forecast for 2024/25 was:
“The global oilseeds production forecast is up over 1.2 million tons to 683.4 million tons this month on higher Argentina, Bolivia, and Canada soybeans, not offset by a decline in Canada rapeseed. Oilseeds trade is slightly lowered to 207.3 million tons as declines in Canada rapeseed exports exceeded a gain in Canada soybean exports. Oilseeds ending stocks are lowered almost 500,000 tons on reduced Canada and China rapeseed stocks and EU soybean stocks. Global crush is increased over 1.2 million tons to 558.2 million tons on higher Argentina soybean crush. Global meal trade is up 1.0 million tons to 107.1 million on higher Argentina soybean meal exports combined with higher Russia and Ukraine sunflowerseed meal exports. Global vegetable oil trade is down over 500,000 tons to 86.1 million as decreases in Indonesia and Malaysia palm oil exports outweigh increased exports of U.S., Argentina, and Brazil soybean oil and Russia and Ukraine sunflowerseed oil. The projected U.S. season-average farm price for soybeans is decreased 60 cents to $10.20 per bushel.”
Average palm oil prices for 2024 were 8.7% higher than 2023 at US$963/tonne, according to the World Bank. The 2024 price was 24.5% less than the 2022 price of US$1,275/tonne, the highest annual price on record. Palm kernel oil prices were 42.5% higher in 2024 than 2023 at US$1,412/tonne.
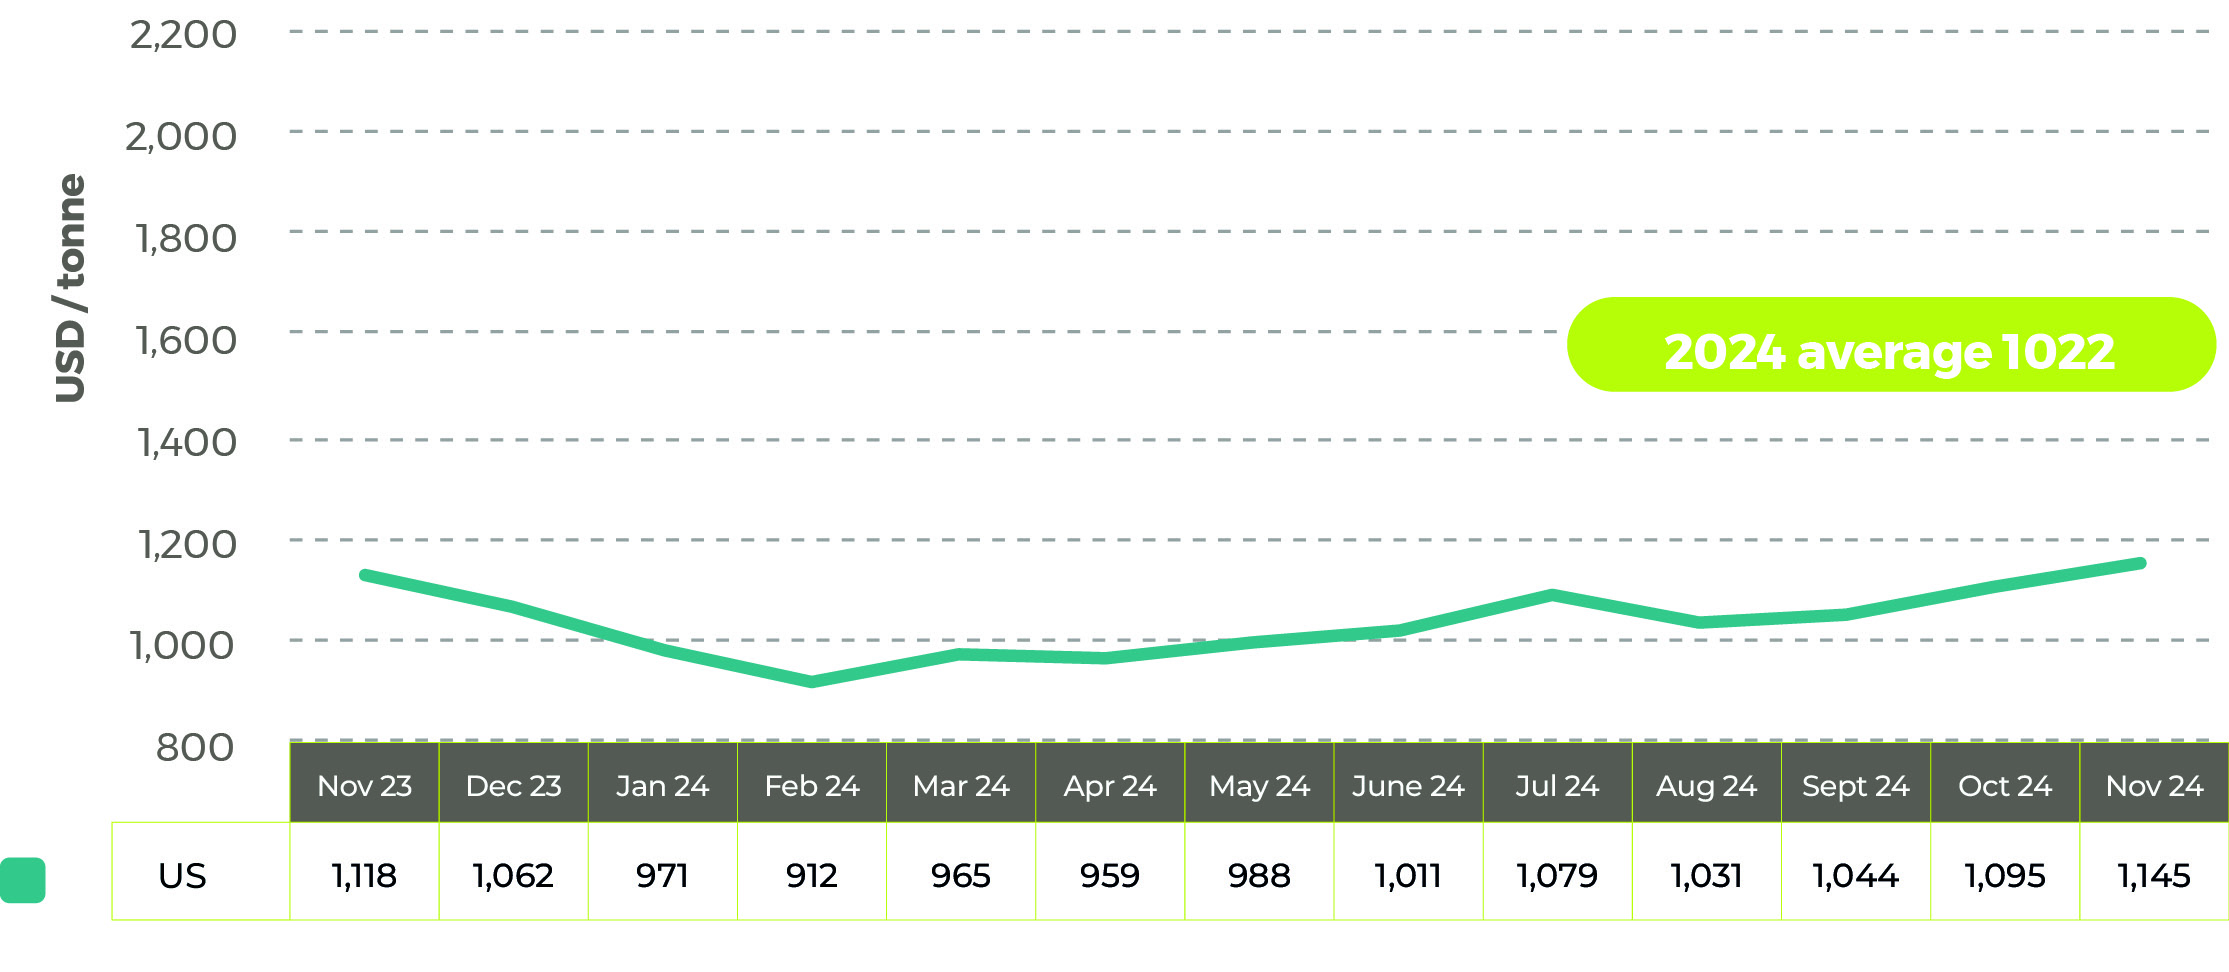
Those prices compared with a 41.2% increase in coconut oil prices to US$1,519/tonne in 2024, according to the World Bank. Groundnut oil prices were 11.7% less at US$1,795/tonne and soybean oil prices fell by 8.6% in the year to US$1,021/tonne.
Average world soybean oil prices in US$/tonne
Shipping Update
Average shipping costs rise by 10% in December 2024
After falling from July 2024 to the end of October 2024, the Drewry World Container Index has increased. In its 2nd January 2025 report, the index was at US$3,905 for a 40-foot container. That value was 10.5% higher than at the start of December and 157% more than the average price of US$1,521 per 40-foot container at the start of 2024. But the latest index is 34.2% more than at its peak in July 2024.
The increase in values in December were largely driven by the higher cost of shipping between Shanghai and New York:
From the 2nd January 2025 Drewry World Container Index report:
- The Drewry WCI composite index increased 3% to $3,905 per 40ft container, 62% below the previous pandemic peak of $10,377 in September 2021 but 175% more than the average $1,420 in 2019 (pre-pandemic).
- The average YTD composite index is $3,905 per 40ft container, $1,040 higher than the 10-year average of $2,865 (inflated by the exceptional 2020-22 Covid period).
- Freight rates from Shanghai to Los Angeles increased 7% or $330 to $4,829 per 40ft container. Similarly, rates from Shanghai to New York rose 6% or $371 to $6,445 per 40ft container. Likewise, rates from Rotterdam to Shanghai and New York to Rotterdam increased 2% to $516 and $838 per 40ft container, respectively. Conversely, rates from Shanghai to Rotterdam decreased 1% or $45 to $4,774 per 40ft container. Meanwhile, rates from Shanghai to Genoa, Los Angeles to Shanghai and Rotterdam to New York remained stable. Drewry expects rates on the Transpacific trade to rise in the coming week, driven by front-loading ahead of the looming ILA port strike in January 2025 and the anticipated tariff hikes under the incoming Trump Administration.
Source: Drewry Supply Chain Advisors

View Drewry shipping data here.
Disclaimer: The information in this document has been obtained from or based upon sources believed to be reliable and accurate at the time of writing. The document should be for information purposes only and is not guaranteed to be accurate or complete.